Net Worth Benchmarks for 2026: Are You on Track?
Most net worth charts have the same effect as swimsuit season lighting, suddenly everyone feels behind. Here is the uncomfortable truth. Net worth benchmarks are useful, but only if you treat them like a compass, not a scoreboard. Direction over domination.
The 2026 backdrop, and why this matters
From 2019 to 2022, the median U.S. family’s net worth jumped about 37 percent, the largest three‑year increase the Fed has recorded. That is not a typo, it was a cocktail of surging home prices, strong markets, and stimulus era cash. Source, the Federal Reserve’s 2022 Survey of Consumer Finances.
Yet most households still feel underwater. Around 60 percent of Americans live paycheck to paycheck, and only 45 percent say they have an emergency fund. About 61 percent carry credit card debt with an average balance near $5,875. Source, CNBC.
Translation, the median moved up, but money stress did not move out. So if 2026 is your year to get serious, start with clean benchmarks and a smarter way to use them.
Net worth benchmarks by age for 2026
Two quick notes before the numbers.
- The Fed’s figures are from 2022. To give a 2026 price‑level reference, we show a simple CPI adjustment of about 3 percent per year. This is a purchasing power comparison, not a market forecast.
- The Fed reports by family, not individual, so compare like with like.
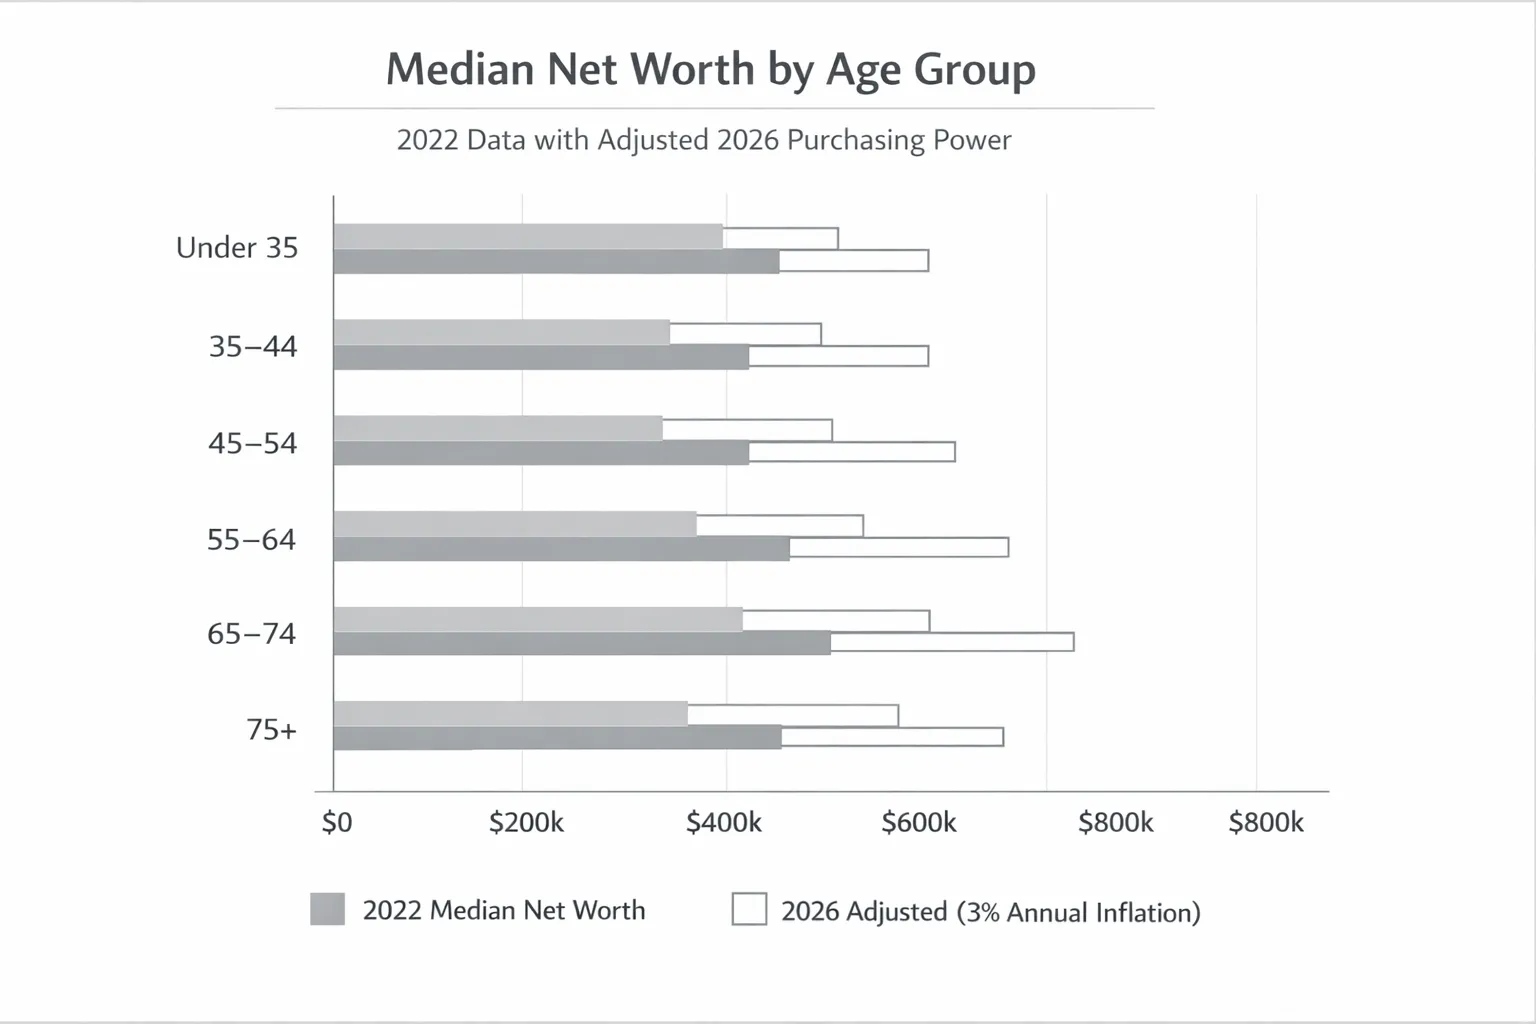
Median net worth by age, data anchor (SCF 2022) and 2026 purchasing‑power reference
| Age group | Median net worth, 2022 | 2026 reference (CPI‑adjusted) |
|---|---|---|
| Under 35 | $39,000 | ~$44,000 |
| 35–44 | $135,000 | ~$152,000 |
| 45–54 | $246,000 | ~$277,000 |
| 55–64 | $409,000 | ~$460,000 |
| 65–74 | $410,000 | ~$461,000 |
| 75+ | $336,000 | ~$378,000 |
Source, Federal Reserve 2022 SCF. 2026 column is a simple inflation reference, not an investment return assumption.
On‑track directional ranges for 2026 (income‑based)
Benchmarks work better when tied to your actual cash flow. Here are practical “on‑track” bands as multiples of annual household income. Use these to judge direction, not to torment yourself.
| Age group | Directional on‑track band |
|---|---|
| Under 35 | 0.5x to 1.5x income |
| 35–44 | 1x to 3x income |
| 45–54 | 3x to 6x income |
| 55–64 | 6x to 10x income |
| 65–74 | 8x to 12x income |
| 75+ | 8x to 12x income, adjust for drawdown |
Example, a 38‑year‑old household earning $120,000 is broadly on track in the $120,000 to $360,000 net worth zone. A 52‑year‑old household at $180,000 income is on track in the $540,000 to $1,080,000 zone. These are ranges, not lines in the sand.
Here is the part nobody talks about. Some people will be “behind” these ranges and still be perfectly fine because their spending is low, they have a paid‑off house, or they plan to work part‑time in their 50s. Others will be “ahead” and still in danger because their lifestyle burn is enormous. Net worth without context is like calories without macros. Incomplete.
A quick story, two 36‑year‑olds walk into 2026
- Ava, 36, lives in Austin, makes $110k, owns a condo, drives a paid‑off Civic. Net worth, $210k. Savings rate, 22 percent.
- Max, 36, lives in Manhattan, makes $210k, rents, runs a balance on two cards. Net worth, $95k. Savings rate, 6 percent.
Who is actually ahead, the person with the higher income or the person with a higher savings rate and growing equity? Ava’s burn rate is lower, her savings muscle is stronger, and her trajectory is better. Direction beats flex.
Why comparisons should be directional, not absolute
- Cost of living varies wildly. A $500k net worth buys different futures in Boise and Boston.
- Households are not identical. Household size, single vs dual income, business owners vs W‑2, all change the math.
- Balance sheet mix matters. $300k in home equity is not the same as $300k in a brokerage account.
- Behavior beats balance. Savings rate and debt habits predict where you will be in five years more than your current number.
One‑liner worth taping to your fridge, You do not need to beat your cohort, you need to beat your past self.
Am I on track, three fast yardsticks
Use all three for a balanced view.
- Savings‑rate yardstick, 15 percent is a minimum viable plan, 20 to 30 percent accelerates FI timelines. Savings rate = (Retirement contributions + taxable investing + cash saved + principal paid on debt) ÷ take‑home pay.
- FI multiple yardstick, Net worth ÷ annual spending. Under 35, aim for 4 to 8. Mid‑career, 8 to 20. Later career, 20 to 30. At 25x spending you are roughly financially independent using a 4 percent starting withdrawal rate.
- Debt drag yardstick, If high‑interest debt APR is greater than your expected portfolio return, it is an anchor. Kill it first.
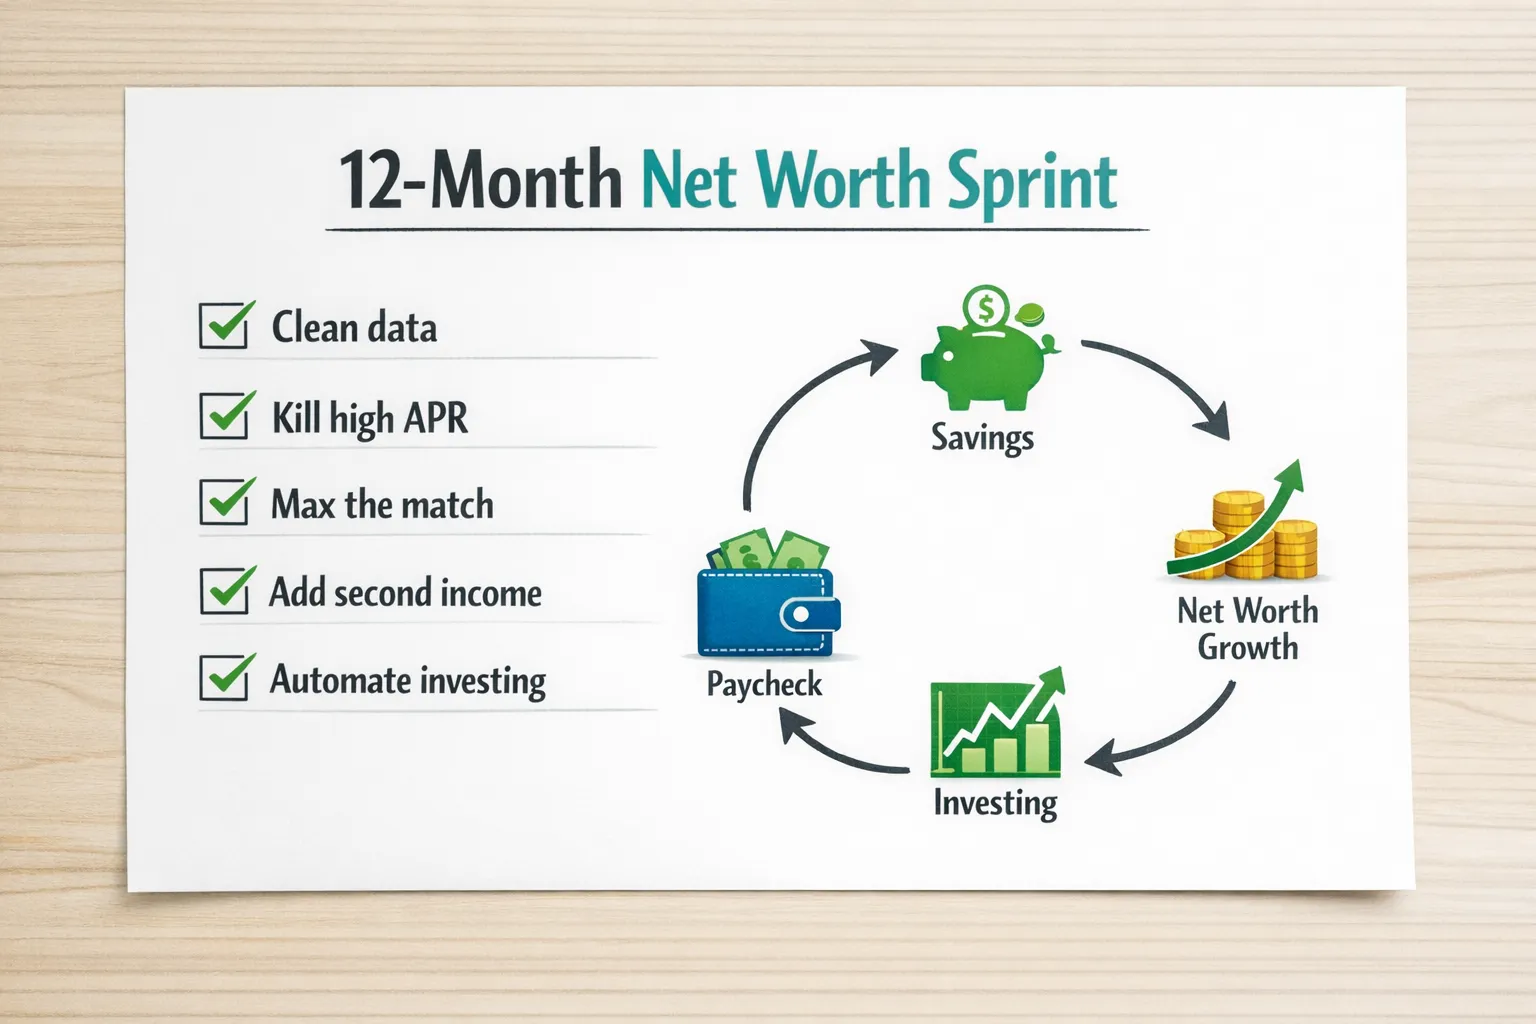
Closing the gap in 12 months, the playbook
Here is a system that moves the needle quickly without turning your life into a monk retreat.
Step 1, get the math honest this week
- Link every account, checking, savings, cards, loans, brokerages, HSA, 401(k), and home value. Add custom assets you would otherwise forget, gift cards, TreasuryDirect, security deposits, prepaid rent, small business equipment.
- Clean your categories and rules so transfers, refunds, and P2P payments do not pollute spending. Your budget is only as good as your data hygiene.
- Run a subscription sweep and flag anything you did not mean to renew.
If you use FIYR, this takes an evening. FIYR tracks net worth, spending, subscriptions, savings rate, and offers custom categories, transaction rules, and labels. One click turns a messy Amazon order into a clean split, and your FIRE date calculator updates in real time.
Step 2, move four big levers in 30 days
- Nuke high‑APR balances, Prioritize any debt over 12 to 15 percent APR. Use avalanche math, but allow yourself a small snowball win to stay motivated.
- Max your match, Increase 401(k) or 403(b) contributions at least to the employer match. Free money is still undefeated.
- Cut three recurring bills, Phone, internet, streaming, insurance. Call and negotiate. Script, “I like your service, but the price is pushing me to switch. What loyalty or promotional pricing can you offer today?” If it is not at least 15 percent off, escalate or switch.
- Add a second income thread, One contract client, one weekend shift, one course sold, one rental listing. The first $500 a month is the hardest, then it compounds.
Step 3, automate the wealth flywheel
- Pay yourself first, Route a fixed percent of each paycheck to investing. Start with 15 percent, edge up quarterly.
- Keep a safe‑to‑spend buffer, Budgets that do not include a guilt‑free buffer fail. In FIYR, your safe‑to‑spend updates as bills, goals, and subscriptions are accounted for.
- Set category caps with guardrails, Groceries, dining, rideshare, and delivery get a cap, plus a soft alert at 80 percent.
Step 4, invest like a grown‑up
- Default to low‑cost index funds in tax‑advantaged accounts first. HSAs, 401(k)/403(b), IRAs, then taxable.
- Rebalance annually, not emotionally. The best portfolio is the one you can hold through a boring bear market.
- Keep cash for real emergencies, not market timing. Three to six months of expenses is the floor, more if your income is variable.
Step 5, make net worth growth a monthly ritual
- First Friday checklist, Update net worth, review savings rate, skim category outliers, cancel at least one zombie subscription, document one move for income growth, a raise, a rate, a referral.
- Label big life events, “New York Trip 2025,” “Home Reno Phase 1,” so spikes in spending do not distort your trendline.
- Track momentum, 12 green months beats one viral month.
Simple scenarios, what “on track” looks like at common incomes
Use these to sanity‑check, not self‑judge.
| Age | Household income | Directional on‑track band |
|---|---|---|
| 32 | $85,000 | $40,000 to $125,000 |
| 40 | $120,000 | $120,000 to $360,000 |
| 48 | $150,000 | $450,000 to $900,000 |
| 58 | $180,000 | $1,080,000 to $1,800,000 |
| 67 | $120,000 pre‑retire | $960,000 to $1,440,000, adjust for drawdown |
If those bands feel aggressive, reduce them when your spending is structurally lower, rural location, paid‑off house, or if you plan to work part‑time. If they feel conservative, increase them for high‑cost metros, multiple dependents, or a later retirement age.
Common traps that make people “feel” behind
- Comparing to means, not medians. A handful of very rich families pull averages up. Medians tell a fairer story.
- Ignoring housing equity and hidden assets, Then declaring yourself broke. Count everything with monetary value.
- Treating taxes like weather, They are not. Optimize account choice and location, pre‑tax vs Roth, HSA, taxable, and you buy back years of freedom.
- Letting credit card balances masquerade as income, If spending spikes with no asset to show for it, you are borrowing from future you.
Use FIYR to make all of this easier, quietly
FIYR was built for people who want mastery, not just tracking. It combines a full money and spending tracker, dynamic budgets with safe‑to‑spend, custom categories and rules, subscription tracking, a savings rate calculator, FIRE projections, and a clean net worth view with any custom asset or liability you care about. It is a modern alternative to Mint, Monarch, Copilot, Rocket Money, and Quicken, especially if you are FIRE‑curious or already FI‑obsessed.
- Start here if net worth is step one, Best App to Track Net Worth in 2025
- Clean up your data quickly, Error‑Proof Budgeting
- Do not forget the money under the couch cushions, Hidden Assets Most People Forget
- Want the FI math, Unlocking the 4% Rule and Boost Your Savings Rate
The punchline
Benchmarks are speed limit signs, helpful hints, not police reports. Use the data to set a direction, then build a system that makes progress automatic. Your goal for 2026 is simple, raise savings rate, lower debt drag, keep investing boring, and watch net worth compound like a habit you are proud of.
One last line to carry into the year, Your net worth is not a personality test, it is a process score. Make your process excellent and the number will catch up.